2008.04.13
GSR Reader
| Published | Apr 13, 2008 |
|---|---|
| Filed under | Arduino · ITP · Physical Computing · Processing · Software · Work in Progress |

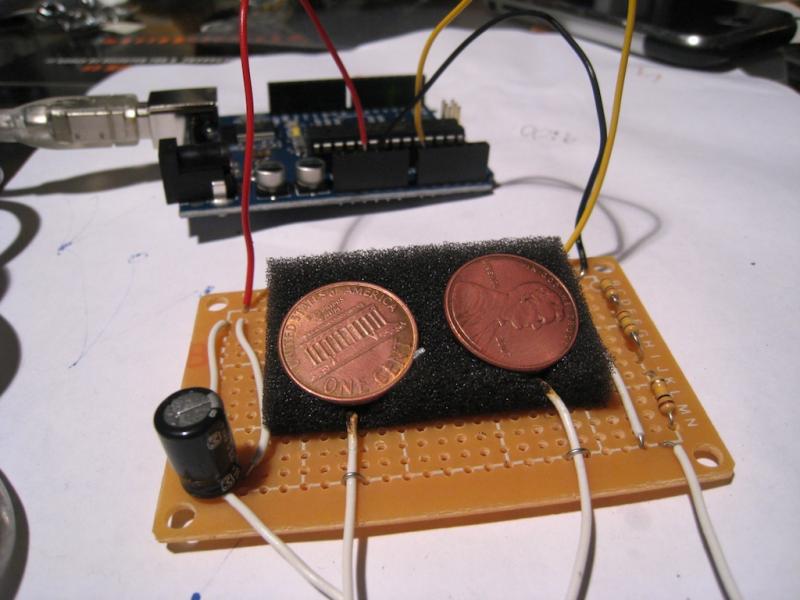
Galvanic skin response readings are simply the measurement of electrical resistance through the body. Two leads are attached to two fingertips. One lead sends current while the other measures the difference. This setup measures GSR every 50 milliseconds. Each reading is graphed, while peaks are highlighted and an average is calculated to smooth out the values. A baseline reading is taken for 10 seconds if the readings go flat (fingers removed from leads).
GSR Reader from che-wei wang on Vimeo.
GSR readings in processing from che-wei wang on Vimeo.
Arduino Code:
void setup(){
  Serial.begin(9600);
}

void loop(){
  int a=analogRead(0);
  if (Serial.available() > 0) {

    byte inbyte=Serial.read();
    if(inbyte=='a'){
      Serial.print(a,BYTE);

    }
  }
}
Processing Code:
import processing.serial.*;
Serial myPort;

int hPosition = 1;     // the horizontal position on the graph
float currentReading;
float lastReading;
int count=0;
int zeroLinePos=0;

float gsrAverage,prevGsrAverage;
float baseLine=0;
long lastFlatLine=0;
color graphColor=color(255,255,255);
int baselineTimer=10000;
int gsrValue;
int gsrZeroCount=0;
float gsrRange=0;
int downhillCount=0;
int uphillCount=0;
boolean downhill;
boolean peaked=false;
float peak, valley;

void setup () {
  size(900, 450);
  // List all the available serial ports
  //println(Serial.list());

  myPort = new Serial(this, Serial.list()[0], 9600);
  currentReading=0;
  lastReading=0;
  gsrAverage=0;
  background(0);

  smooth();
}

void draw () {
  //best delay setting for gsr readings
  delay(50);
  //image(myMovie, 0, 0);

  if (gsrValue-15){
    if( gsrZeroCount>10){
      currentReading=0;//flatline
      gsrAverage=0;
      baseLine=0;
      lastFlatLine=millis();
      gsrZeroCount=0;
      // println("reset");

    }
    gsrZeroCount++;
  }
  else{
    currentReading=gsrValue-baseLine;
    gsrZeroCount=0;
  }

  if(millis()-lastFlatLine>baselineTimer){
    baseLine=gsrAverage;
  }

  //graph colors
  if(gsrAverage>0 && gsrAverageheight/2.0*.25 && gsrAverageheight/2.0*.5 && gsrAverageheight/2.0*.75) graphColor=color(255,100,0);

  gsrRange=peak-valley;

  // at the edge of the screen, go back to the beginning:
  if (hPosition >= width) {
    hPosition = 0;

    //cover last drawing
    fill(0,200);
    noStroke();
    rect(0,0,width,height);
  }
  else {
    hPosition+=1;
  }

  gsrAverage=smooth(currentReading,.97,gsrAverage);

  //draw stuff

  //spike
  noStroke();
  if(gsrRange>200){
    fill(255);
    ellipse(10,10,20,20);
  }
  else{
    fill(0);
    ellipse(10,10,20,20);
  }

  //graph
  strokeWeight(.5);
  stroke(graphColor);
  line(hPosition-1, height/2.0-lastReading, hPosition, height/2.0-currentReading);
  stroke(255,0,100);
  line(hPosition-1,height/2.0-prevGsrAverage,hPosition,height/2.0-gsrAverage);

  //draw peaks
  int thres=7;

  noFill();
  stroke(255,0,0);
  strokeWeight(2);

  if (currentReading-thres>lastReading&& peaked==true){
    downhill=false;
    //println(downhillCount);
    uphillCount++;
    downhillCount=0;
    point(hPosition-1, height/2.0-lastReading);
    valley=lastReading;
    peaked=false;

  }
  if(currentReading+thres 1){      // check to make sure param's are within range
    filterVal = .99;
  }
  else if (filterVal